Looking at the size of the breakdown of the inventory for February, 2014, the information from MOA is difficult to determine the basic numbers, but there appears to be quite a large drop in on farm inventory and a drop in breeding stock numbers over the past few months. MOA states that January on farm inventory was down 4.2 per cent and breeding stock was down 0.6 per cent from the previous reporting period (not sure if this means December or November, 2013).
As compared to November 2013-breeding stock was around 50.33 million and total on farm inventory was around 458.75 million. If one compares to November 2013, then about 19.27 million pigs in inventory changed (decreased) so that on farm inventory would be 439.48 million head for January 2014.
This seems like an extreme number and it could be that the original count has been adjusted ( usually the month of January, the MOA makes an adjustment of the inventories) or other factors such as disease, cold weather and/or home consumption (mainly backyard farms) for Spring Festival, have all affected the total on farm inventory.
For January, 2013, the breakdown of the inventory for breeding stock was around 51.30 million and total on farm inventory was around 446.79 million (again from the January 2014 report from MOA, it states that on farm inventory was down 2.2 per cent from January 2013-thus for January 2014, a total of 436.96 million head. Calculations by either way means a large drop in on farm pig inventory reported for January 2014.
Now if we take an average for January 2014 of 438.2 million on farm inventory and we calculate the sow herd at 50.0 million, then February, 2014 inventory would be 433.03 million head ( down 0.9 per cent from last month and down 1.1 per cent from last year). Breeding stock would be 49.6 million sows (down 0.8 per cent from last month and down 3.5 per cent from last year).
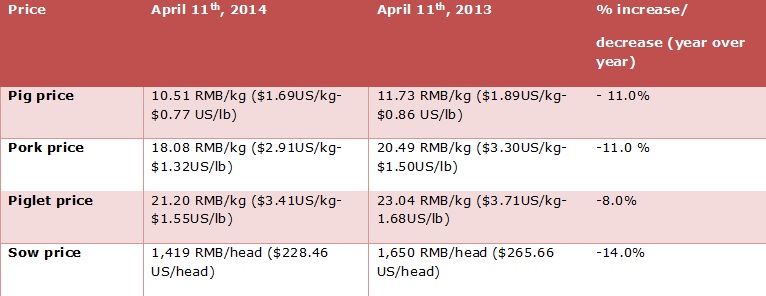
Profit margins are now showing heavy losses. On April 11th, a farrowto finish operation was losing 357 RMB/head ($ 57.48 US/ market pig). Some analysts calculate well over 400 RMB/head ($ 64.40 US/market pig) loss for some newer, more financially leveraged farms. On February 19th, 2014 it was reported that the losses for a farrow to finish operation was 199 RMB/market pig ($ 32.04 US/ market pig). Compared to one month before (January 15th), it was reported that profits for a farrow to finish operation was 49.06 RMB/market pig ($ 7.90 USD/market pig). This is down by 96.01 RMB/market pig ($ 15.46 USD) from the week before-January 8th (a 66.18 per cent decrease in 1 week). Over the past 16 weeks, there has been a continuous decline in profits and now large losses. Many farmers report that the current losses are the worst in 15 years.
The Consumer Price Index (CPI) continues to be quite interesting for the National Government. Previously, when the pork prices were gaining, this rapid increase in pork, gained the attention of the National Government as it greatly affects the CPI. The CPI is made up of about 30 per cent food found in the consumers’ basket. Pork is estimated to be about 1/3 of the food portion of the basket or in other words, about 10 per cent of CPI as a whole. Currently, inflation is around 2.5 per cent for March. Now, low pork prices are keeping the CPI lower.

What to watch for over the next few months
Last week, (April 11th), the pig to grain ratio was 4.4:1 down 12 per cent from last year. On February 20th, the pig to grain ratio was 5.49:1. This is sharply lower than at January 15th, 2014, when the pig to grain ratio was 6.18:1. This fell from 6.52:1 from the week before (January 8th). At the end of October, the pig to grain price ratio was 6.59:1. On the whole, in 2013 the national average of pig grain price ratio was 6.15:1 as compared to 6.25:1 in 2012 ( fell by 1.6 per cent- The chief reason was related to the pig market losses of more than five months during the spring and summer of 2013).
On April 11th, 2014, the average corn price was 2.29 RMB/kg or $0.37 US/kg or 0.17US/lb. The retail price to farmers for soybean meal would be 3.83 RMB/kg or $0.62 US/kg or $0.28US/lb. The national average wheat bran price was $2.02 RMB/kg ($0.33US/kg or $0.15US/lb).
On February 19th, the NDRC announced that plans were being put in place for the preparation to buy pigs from the market and to store in frozen pork reserves to “prevent the excessive decline in hog prices”. The goal is to help to stabilize pig production and to maintain breeding stock inventories. By the end of March, the State had purchased about 65,000 tons. Some prices, especially in NE China spiked briefly, but now, the general overall price is still too low.
The import of over 500,000 tonnes of US soybeans has been cancelled so far in 2014. Other reports indicate that soybean exports to China from other countries have also seen cancellations. International prices are being depressed and some rising fears over China’s economy are also being mentioned by reporters. Originally, the USDA forecasted that China would import 68 million tons of soybeans in 2013/14 crop year, but now that prediction is sitting at 62 million tonnes.
China’s corn production is rebuilding and is estimated to hit record tonnes for the next 2 crop years. Imports will likely be reduced and government grain reserves will be replenished. Already, more than 54.66 million tonnes of corn from the 2013/14 crop year have been purchased and put into government grain bins-March 10th report).
Corn production is estimated at 217 million tonnes for 2013/14 and 218 million tonnes for 2014/2015 crop years (government subsidies direct farmers to grow more corn and fewer soybeans and other crops). Imports for corn are estimated at 4 million tonnes this crop year and 3 million tonnes for next crop year. Imports of sorghum, cassava and DDGs could increase. Sorghum imports have been increasing as farmers find the product to be a good feed ingredient.


