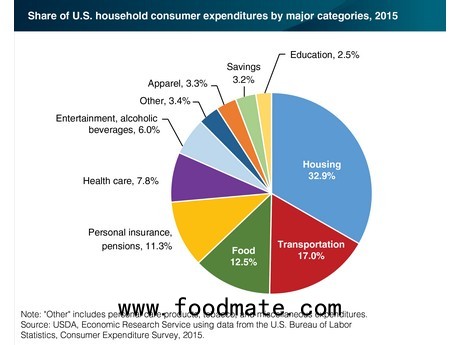
Over the last 10 years, retail food price inflation has often outpaced economy-wide inflation. Between 2006 and 2015, prices for all U.S. goods and services rose an average of 2 percent per year, while food prices increased an average of 2.7 percent. Despite higher food price inflation, food’s share of consumer expenditures fell slightly (0.1 percentage points) over the decade, as the budget shares for health care and personal insurance and pensions rose. Food’s share of consumer expenditures may be smaller in 2016 as grocery store food prices fell by 1.3 percent in 2016.


