Despite this, the study showed that reformulation can still be achieved.
Furthermore, new data from the recently published report by Public Health England shows that many cake and biscuit manufacturers are failing to reformulate and reduce the amount of sugar sold in their products.
Kawther Hashem, co-author of the study and Registered Nutritionist, for Action on Sugar says: “This research clearly shows the levels of sugar and calories in products can be reduced since there was a large variation in sugar and calorie content within the same category of cakes and biscuits, yet worryingly, not all manufacturers are complying. If some manufacturers can produce chocolate cake bars with 22 percent fewer calories per 100g, so can others.”
“Many of these are hidden in so-called ‘healthy’ foods such as breakfast cereals with claims of vitamins and minerals on the front of the pack, while ‘hiding’ the high sugar content to the back of packs,” she tells FoodIngredientsFirst.
Graham MacGregor, co-author of the study and Chairman of Action on Sugar also notes: “Large amounts of cakes and biscuits are consumed in the UK so a reduction in the amount of sugar and calorie content could play an important role in helping prevent obesity and tooth decay. The majority of the food and drink industry in the UK has asked the government for a more robust and mandatory program of reformulation. It is a tragedy for our children that this has not yet been done.”
Findings from the study show that Lotus Bakeries increased sugar sold on average in their biscuits by 3.7 percent, Tesco (2.6 percent increase), Fox’s Biscuits (1.3 percent increase), Pladis UK/McVities (1.3 percent increase) and Mondelez (1.0 percent increase) – all failing to meet the 5 percent sugar reduction target. In cake, Tesco (4.0 percent increase) and Sainsbury’s (0.6 percent increase) also increased the amount of sugar sold through cakes instead of meeting the 5 percent reduction target.
In contrast, some companies made substantial reductions in the amount of sugar sold through cakes, exceeding the 5 percent target including Asda (-22.9 percent decrease) and Waitrose (-27.0 percent decrease). While, General Mills (-8.8 percent), the Co-operative (-8.0 percent) and Asda (-5.2 percent) reduced-sugar sold through biscuits.
Cakes
In the BMJ Open paper, the average sugar content in cakes was 36.6g/100g coupled with a large variation in sugar content between different categories of cakes. On average, Battenberg (56.4g/100g) contained the highest amounts of sugar, followed by Genoa (45.9g/100 g) and red velvet cakes (44.2g/100g), while blueberry muffins (24.6g/100g) contained the lowest amount of sugar.
More importantly, there was a large variation within the same category of cake, e.g., among Victoria sponge or similar cakes, ranging from 23.4 to 59.2g/100g. This variation demonstrates that reformulation can easily be done, for example, if some manufacturers can produce a similar cake with far less sugar or calories so can others. In the per serving analysis, consumers can find a Victoria sponge with as little as 11.9g sugar compared with a slice containing 34.3g sugar – a difference of 6 tsp.
Similar to sugar, there was also a large variation in energy/calorie content between different categories of cakes. On average, plain sponge with chocolate (446 kcal/100g) contained the highest amount of energy, while Genoa cakes (356 kcal/100g) contained the lowest amount of energy. Again, there were large variations within the same category of cakes such sd chocolate Swiss rolls, ranging from 366 to 500 kcal/100g.
Branded cakes had a slightly higher sugar content per 100g compared with own supermarket label (37.7g vs. 36.3g). Among the manufacturers with five or more cakes, the McVitie's product range contained the highest average sugar (43.1g) and Premier Foods contained the highest energy (424 kcal) per 100g.

Biscuits
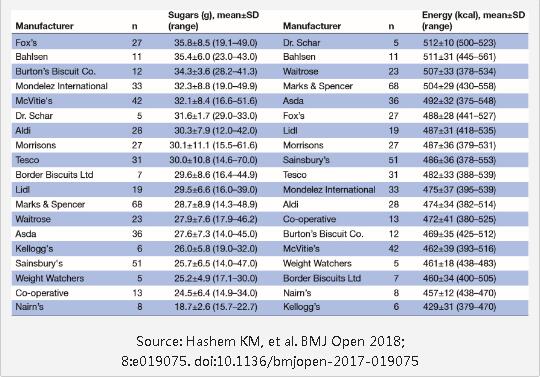
The average sugar content in biscuits was 30g/100g as well as a large variation in sugar content between different categories of biscuits. On average, iced biscuits (43.5g/100g) contained the highest amounts of sugar and shortbread biscuits (17.5g/100g) contained the lowest. More importantly, there was a considerable variation in sugar content within the same category of biscuits, e.g., among breakfast biscuits, ranging from 12.0 to 30.9g/100g.
The average energy content in biscuits was 484 kcal/100g. Shortbread biscuits with additions (528 kcal/100g) contained the highest amount of energy and fruit-filled biscuits (391 kcal/100g) contained the lowest amount.
Similarly, there was a significant variation in energy content in similar biscuit products, e.g., among jam and cream biscuits, calorie content ranged from 425 to 558kcal/100g.
Among the manufacturers with five or more products, Fox’s product range contained the highest average sugar content, 35.8g/100g, and Dr. Schar product range contained the highest average energy content, 512 kcal/100g.
In 2016, the government’s sugar-reduction program was launched, where food and drink companies were asked to reduce sugar in their products by 20 percent by 2020. Manufacturers can choose to achieve the 20 percent reduction in a number of ways; by reformulating their products (without increasing overall calories), reducing portion size or promoting their lower sugar products.
Source:http://www.foodingredientsfirst.com


