Dr. Darrell Good presented the group’s outlook for 2013 crop and livestock prices. Some highlights from the published paper are:
• Crop prices will remain very volatile due to production uncertainty and continued turmoil for broader economic issues. A transition to lower prices is anticipated and the extent of the price decline will be largely determined by the size of 2013 crops.
• Smaller corn crops in other parts of the world and continuing strong demand will reduce overseas inventories — on top of the obvious reductions in U.S. stocks that have resulted from the poor 2012 crop. Argentine corn production, which, at 827 million bushels, was down 17% yr/yr last year, is expected to improve to 1.102 billion bushels this year — a gain of 33%.
• “Stable” U.S. acreage and a return to a trend yield (which Dr. Good’s slides indicate would be about 163 bu. per acre) would result in a U.S. corn crop in excess of 14 billion bushels, “allowing a substantial rebuilding of inventories.” Where average U.S. farm prices will average above $7 for the ‘12-’13 marketing year, prices for the ‘13-’14 marketing year could be from $4,75 to $5.50.
• Sharply higher late-2012 soybean prices were driven by small crops in both South America and the U.S. Current expectations are for a record-large South American harvest. “Stable” acreage and a return to trend soybean yield (which appears to be about 44 bushels/acre from Dr. Good’s slides) would put the 2013 crop very near the 2009 record. Larger crops in both major growing areas would expand world inventories and push the U.S. average farm price for beans into the $11 to $12/bushel range, sharply lower than the expected “12-’13 average of $14.50.
• U.S. wheat production rebounded nicely in 2012 but output in the rest of the world fell, improving U.S. export demand. High corn prices helped wheat by driving more wheat feeding but year-end stocks will be adequate. Good expects U.S. wheat acreage to expand to roughly 56 million acres in 2013 but the big concern remains drought conditions in the hard red wheat growing areas of the U.S. Prices will remain high for the first half of 2013 but will decline into the range of $6 to $7 in the second half of the year.
• U.S. pork production is expected to decline from 23.26 billion pounds in 2012 to 22.94 billion pounds (-1.4%) in 2013. The U of I economists expect exports to remain stable near 2012 levels, lowering U.S. per capita pork supplies from this year’s 45.7 pounds to just 44.9 pounds in 2013. Live prices of $64/cwt ($85.33/cwt carcass) are expected for the coming year. Those compare to $61 live ($81.33 carcass) in 2012 and $66 live ($88 carcass in 2011.
• Beef production is forecast to decline from 25.7 billion to 24.6 billion pounds in 2013. Lower production will limit 2013 exports to about 2.45 billion pounds, down slightly from this year’s 2.47 billion pounds. Domestic per capita availability will be 54.8 pounds in 2013, a full 2 pounds lower than the 56.8 pounds available to U.S. consumers in 2012. The U of I team has fed cattle prices pegged at $125 in 2013, $3 higher than the 2012 average.
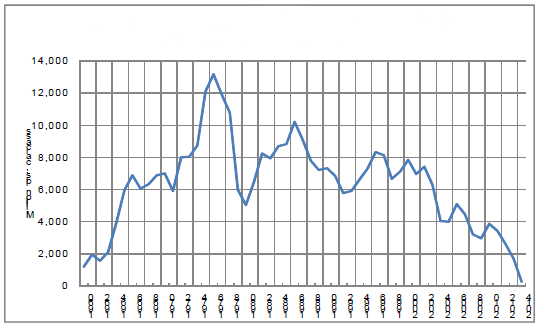
We found two numbers in the U of I paper almost shocking — 2013 forecast beef and pork production differ by only 1.7 billion pounds. And what is even more shocking is that the Livestock Marketing Information Center’s forecasts for 2014 are for beef output to be 23.743 billion pounds and pork production to be 23.199 billion pounds, a difference of only 274 million pounds.
As can be seen below, beef production was once nearly 13 billion pounds larger than pork production and it could be virtually the same in two years. For the record, net ready-to-cook chicken production is forecast to be a record 37.119 billion in 2014. That chicken weight does include a higher proportion of bone and skin but chicken’s lead is still formidable.
US Beef Production Minus US Pork Production

Finally, a collection of populist farm groups has called on the Justice Department to block the purchase of the XL Four Star Beef plant in Omaha by JBS Swift. The group claims the acquisition will add to market power in the beef sector. It should be noted that about any change in packer structure other than the closure of a plant would likely get the same opposition from this group.
The Omaha plant processes cows. As can be seen from the Packers and Stockyards data below, this is the least concentrated of any U.S. slaughter sector. Our information indicates that JBS Swift has no cow slaughter operations at present so we’re not sure how the purchase could increase concentration in that sector.
| Four-Firm Concentration Ratios | ||||||
|---|---|---|---|---|---|---|
| Species | 2010 | 2009 | 2008 | 2007 | 2006 | 2005 |
| All Cattle | NA | NA | 69 | 70 | 70 | 70.6 |
| Steer/Heifer | 85 | 81 | 79 | 80 | 81 | 80 |
| Boxed Beef | NA | NA | 76 | 80 | 84 | 83 |
| Cows/Bulls | 52 | 53 | 55 | 55 | 54 | 48 |
| Sheep/Lamb | 65 | 70 | 70 | 70 | 68 | 70 |
| Hogs | 65 | 63 | 65 | 65 | 61 | 64 |
| Source: USDA GIPSA, 2011 Packers & Stockyards Program Annual Report |
||||||


